In yesterday’s Fivethirtyeight article, I argued that evidence of nonresponse bias is “hard to come by,” with the exception of “the highest of high profile events.” Prof. Andrew Gelman, primary author the study I linked to showing evidence of non-response bias after the first presidential debate in 2012, emailed to disagree, saying he sees such survey error “as more of a routine matter.”
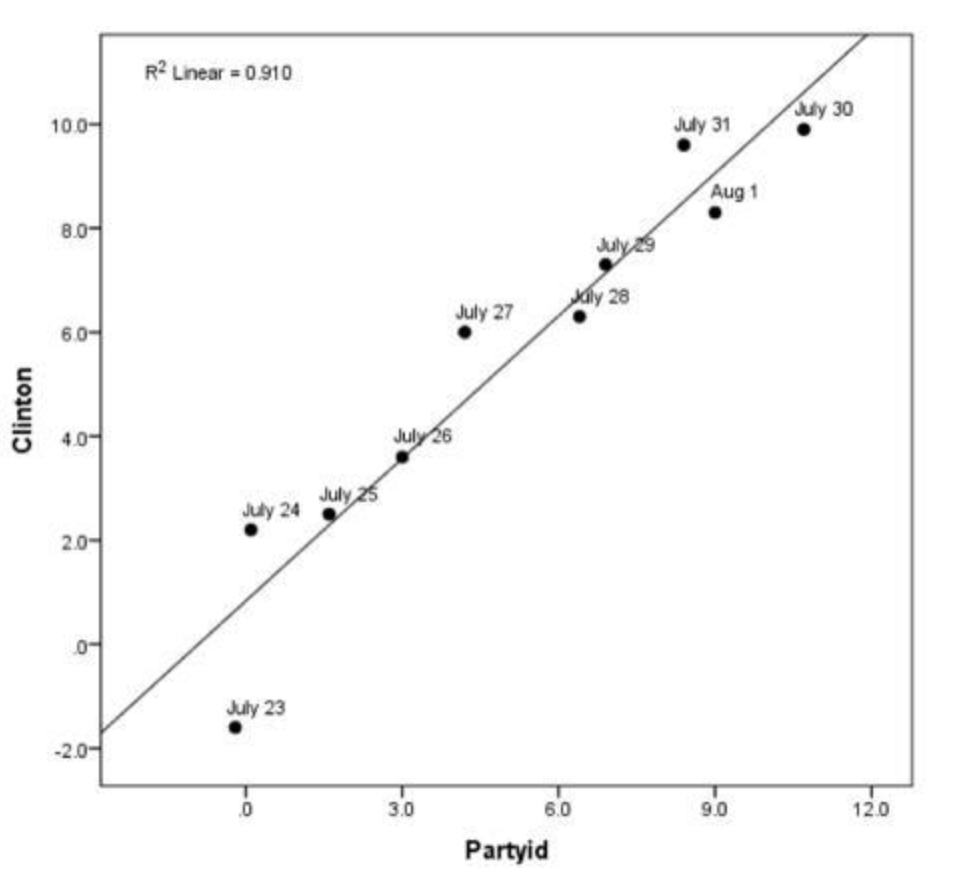
Gelman’s email points specifically to an article he and David Rothschild wrote for Slate in 2016, which argued that non-response bias drove that year’s post-convention bounces. The article included a chart, reproduced below, showing how support for Clinton in the pre-and-post debate period correlated strongly to party identification. In other words, variation in support for Clinton appeared to be more about the mix of Democrats and Republicans who participated in the surveys than about individuals changing their opinions.

“Trump’s Up 3! Clinton’s Up 9! Why you shouldn’t be fooled by polling bounces.”
Gelman concludes, via email:
So I think differential nonresponse is a general phenomenon, not at all restricted to the highest of high-profile news events. The more general way to look at it is that voter turnout in presidential elections is about 60%–i.e., most people who can vote, do so–but survey response rates are below 10%. So it’s no surprise that “turnout” to respond to a survey has a big effect on the results of the poll.
A couple of thoughts: First, Gelman is always worth listening to, as he is a prominent authority on efforts to correct nonresponse bias with advanced statistical modeling and, of course, authored one of the important studies my article linked to.
Second, I’ll concede that convention bounces belong in the category of rare blockbuster events with the potential to produce nonresponse bias. They happen only once a presidential election cycle and briefly create the same sort of one-issue environment – media reports focused on one side’s message or on one side winning – that was also evident in coverage of the first 2012 debate, the 2016 Access Hollywood tape and the latter phase of the Kavanaugh hearings.
Finally, I have little doubt that non-response bias contributed to the wide variation in party identification that Gelman and Rothschild illustrate in pre- and post-convention polling in 2016. Keep in mind, however, that we would likely see a high correlation between presidential vote and party ID at any time, though arguably not with the same wide variation as during the convention period in 2016. Such correlation alone is not necessarily evidence of nonresponse bias: Party ID can vary for other reasons – including random variation and measurement error – and we know party ID is a strong predictor of vote, so the two should always correlate.
All of this feels mostly like a quibble. I have long agreed with Gelman that nonresponse bias needs to be taken more seriously. And whether you think differential nonresponse bias occurs rarely or often, my advice at the end of yesterday’s article remains pertinent: Caution is always in order when interpreting sudden changes in polling trends. And recontact (panel) studies and voter list samples (that include data on partisanship) are vital in catching non-response bias as it happens.