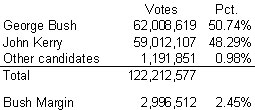
Some news from GMU Prof. Michael McDonald by way of Ruy Teixeira – the final tabulation of the national popular vote based on the “official” count:

This tabulation includes roughly 5 million votes that were not included in the final news media reports released on November 11 (the difference is presumably some combination of provisional ballots and late arriving absentees). As Ruy pointed out, the additional votes narrowed President Bush’s victory margin slightly, from 2.95% (using the numbers posted by USA Today) to 2.45%.
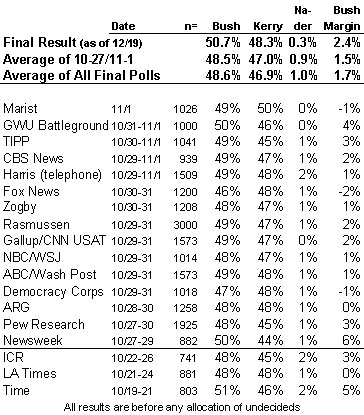
I point this out because of a post I did in November that compared the final national polls to the actual outcome and concluded that “most of the surveys done in the final week (11 of 15) had a ‘bias’ toward Kerry – they showed Kerry ahead or had the margin closer than three points.”
I updated the table from my earlier post (see below) using the new official tally. The problem with applying the real 2.4% margin is that the national polls are typically rounded to the nearest whole digit. If we round down and assume a 2-point margin, the distribution of surveys looks more “normal”: 7 had Kerry too high, 4 had Bush too high and three reported 2-point margins. I don’t want to make too much of this – the main point is that the average margin reported by the polls in the final week (1.5%) looks closer to the final official result (2.5%) than it did in November (when it was reported as 2.95%).

Sadly (for me), the data above show, once again, that the incumbent rule did not hold in the presidential race in 2004. Those who were still undecided on the final survey either did not vote or split evenly between Bush and Kerry. I am hoping to do more comparisons using the final official numbers at the state level soon, but I expect the result in the Presidential race should be consistent.
Stay tuned…
(the difference is presumably some combination of provisional ballots and late arriving absentees). As Ruy pointed out, the additional votes narrowed President Bush’s victory margin slightly
This happened in 2000 also (the final vote count showed a lower percentage for Bush than the right-after-the-election count) and I don’t understand it, because my understanding is that absentee ballots tend to favor the Republican presidential candidate by some appreciable margin. Most of these are presumably the absentees (in both elections), yet they seem to swing the vote in the other direction. Could you comment?
“(the difference is presumably some combination of provisional ballots and late arriving absentees). As Ruy pointed out, the additional votes narrowed President Bush’s victory margin slightly”
This happened in 2000 also (the final vote count showed a lower percentage for Bush than the right-after-the-election count) and I don’t understand it, because my understanding is that absentee ballots tend to favor the Republican presidential candidate by some appreciable margin. Most of these are presumably the absentees (in both elections), yet they seem to swing the vote in the other direction. Could you comment?
Whole-percent roundoff’s are not so easily accounted.
Worst case, a reported +2% margin could represent anything from a +1% actual margin (winner rounded up by ~.5%, loser rounded down ~.5%) to a +3% actual margin (vice versa).
It’s reasonable under these circumstances to treat the winner’s reported share, say 51%, as uniformly distributed from 50.5% to 51.5% … which gives the margin a either a uniform distribution from +1% to +3% (if those are the only choices) or a triangular distribution from +1% to +3% (if other/none/etc are present).
THEN you could properly normal MoE tests, etc., weighted across these distributions … if you had time … but you don’t … and neither do I. Long story short, these effects tend to widen the conventional MoE band.